

School Performance
Primary (key stage 2) performance in 2022
The Government will not publish KS2 school level data for the 2001 to 2022 academic year. The last available public data is from the 2018 to 2019 academic year. It is important to note that the data from that year may no longer reflect current performance.
School and College Performance Tables Service - Rift House Primary School
Note: for individual key stage and subject specific attainment outcomes, please see pupil premium section of the website.
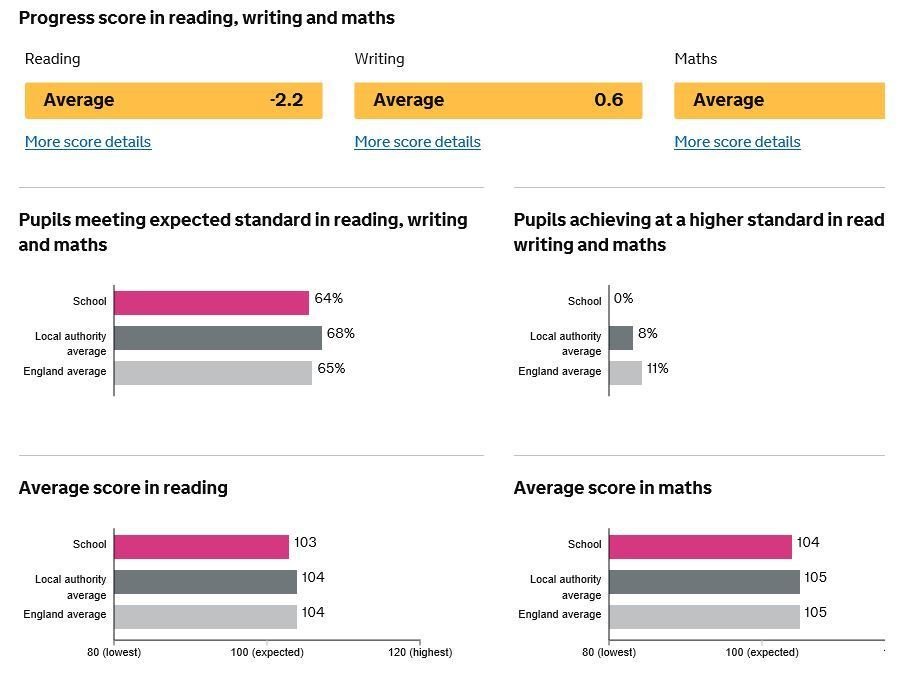
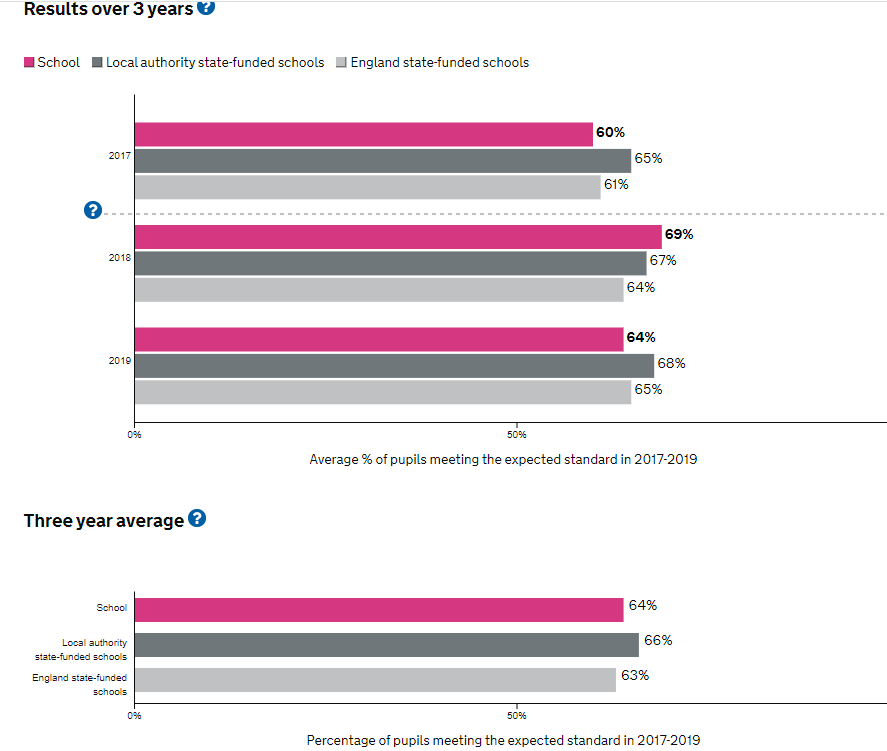
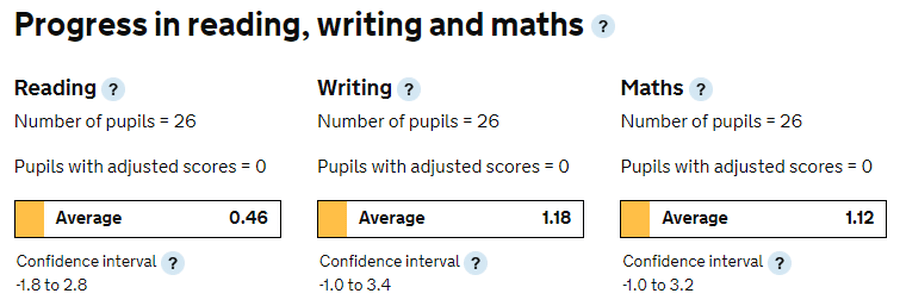
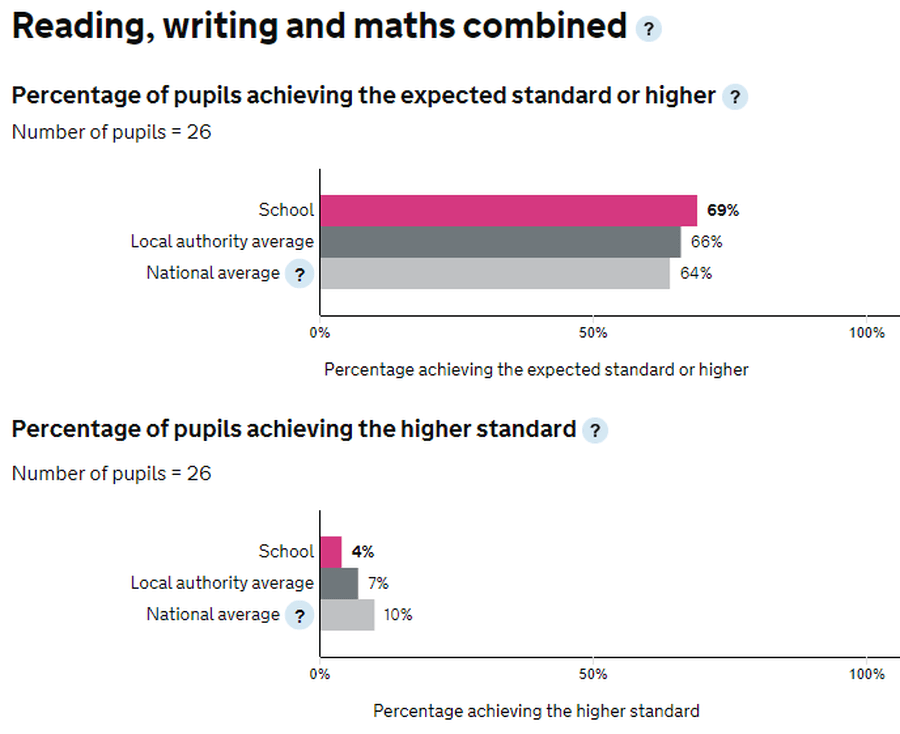
Primary (key stage 2) performance in 2019
Progress in reading, writing and maths
This is provisional data for 2018/19. Any amendments made to this school's data will be reflected when we re-publish the data in a few months. National and local authority benchmarks may also change. Until these changes take effect, you may see differences between data on ASP and Compare school and college performance.
Primary (key stage 2) performance in 2018
Progress in reading, writing and maths
This is provisional data for 2017/18. Any amendments made to this school's data will be reflected when we re-publish the data in a few months. National and local authority benchmarks may also change. Until these changes take effect, you may see differences between data on ASP and Compare school and college performance.

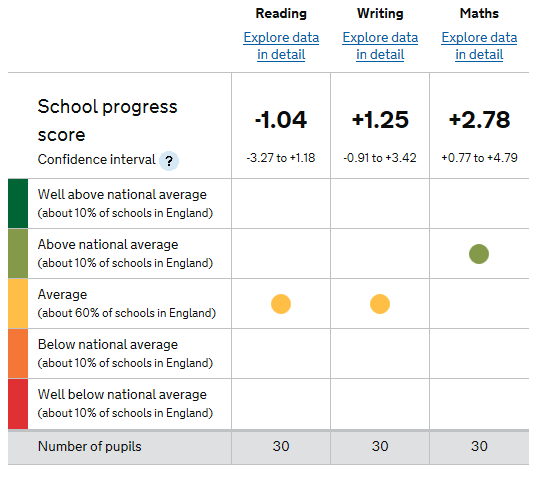
Primary (key stage 2) performance in 2017
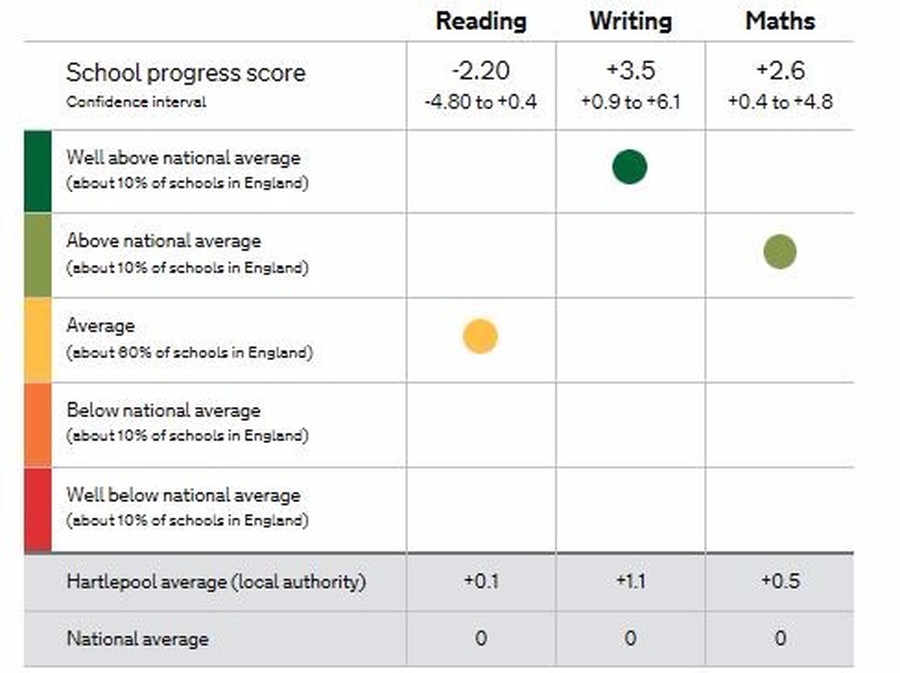
Progress in reading, writing and maths
These scores show data for how much progress pupils at this school made in reading, writing and maths between the end of key stage 1 and the end of key stage 2 , compared to pupils across England who got similar results at the end of key stage 1.
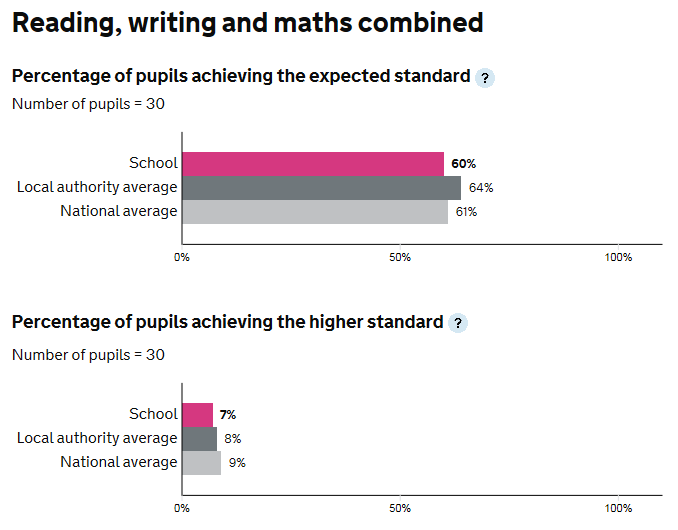
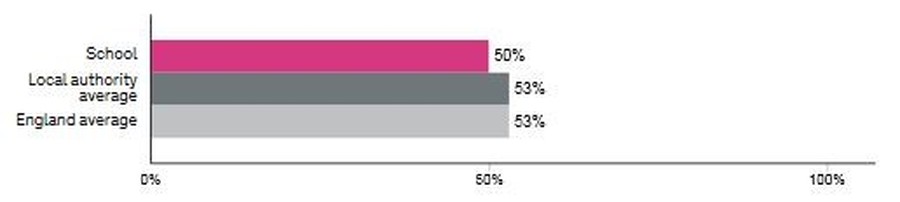
Percentage of pupils meeting the expected standard in reading, writing and maths
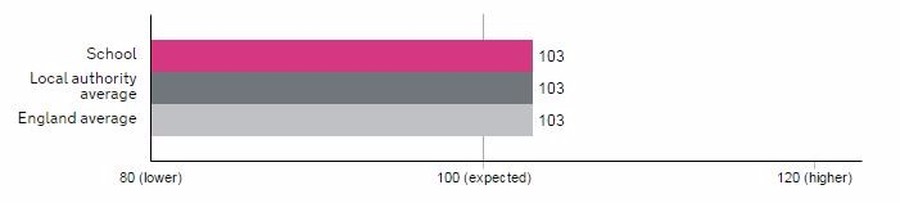
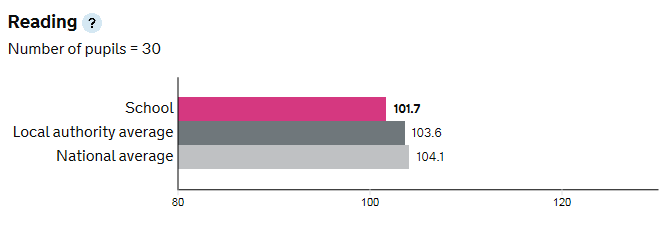
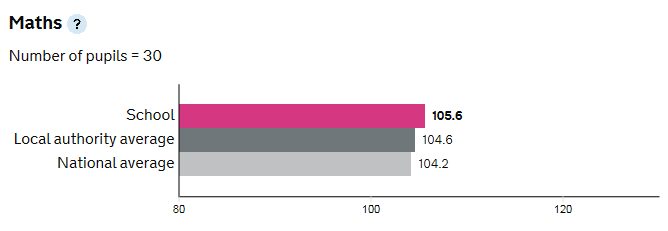
Average SCALED scores
Primary (key stage 2) performance in 2016
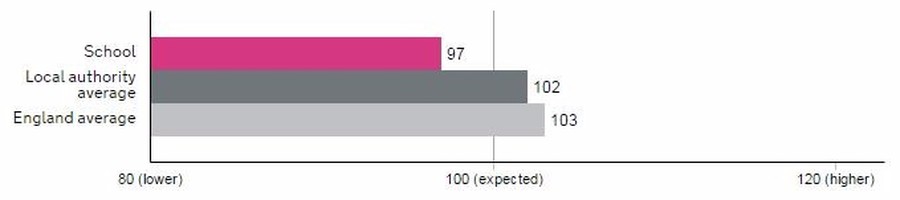
Progress in reading, writing and maths
These scores show how much progress pupils at this school made in reading, writing and maths between the end of key stage 1 and the end of key stage 2 , compared to pupils across England who got similar results at the end of key stage 1.
Percentage of pupils meeting the expected standard in reading, writing and maths
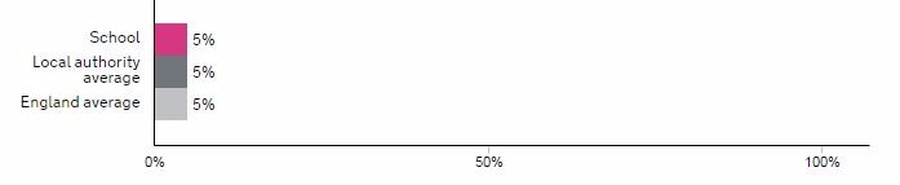
Percentage of pupils achieving at a higher standard in reading, writing and maths
Average score in reading
Average score in maths